Introduction
Understanding mountain weather forecasts is a vital part of planning a day out in the mountains, especially in winter.
Over the next three months I’ll explain how I go about using different resources to understand the mountain weather that is currently forecast. This should enable me to make the best decisions before and during my planned trip.
I will try to explain:
- What my overall thought process is.
- Which weather forecast websites and apps I use, and how, at different stages.
- What mountain weather information I look for at different stages of my planning.
There are several caveats to this:
- In this article I am not going to attempt to explain the weather characteristics themselves.
- There are many other sources, websites and apps that others use. I’m just explaining which ones I use, and how.
- Not everyone will agree with my preferences. If you have a way of understanding the mountain weather that works for you, then that’s fine. This is just how I like to do it.
If you have not given this too much thought before, then hopefully this article will help point you in the right direction.
Three-Stage Process for Researching Mountain Weather Forecasts
I tend to follow a three-stage process when I’m planning my mountain days out. This works along the following lines:
- National forecast and outlook.
- Regional mountain weather forecasts.
- Local (specific) mountain summit weather forecasts.
Here’s the explanation for this.
First, I want to understand what the overall picture is for the weather affecting the whole of the UK. This will help me make my big decisions, such as which region to go to. This is the subject of this month’s article and I’ll explain more shortly.
Next, I look at the regional forecast in more detail so that I understand the mountain conditions that I’m likely to encounter there. This also helps me to make the big choices about where I may go, but also to make a specific plan for the day. I’ll write more about this, especially using apps, in June.
Finally, I’ll look at very detailed and specific information about the exact mountain that I’m going to, and how the weather will affect my route choices and decision-making during the day. This includes use of the avalanche forecast in winter. More on this will follow in July.
Weather Forecast Websites and Apps
I have played around with a lot of different resources, and to an extent I still do. But now I have largely settled on three main sources of information for my mountain weather planning. I choose which to use depending on what stage of my planning I am at; and whether I have access to a desktop computer screen or am using my smartphone only.
- Met Office website. This has excellent overview information as well as very detailed and specific mountain weather forecasts. It is updated regularly during the day.
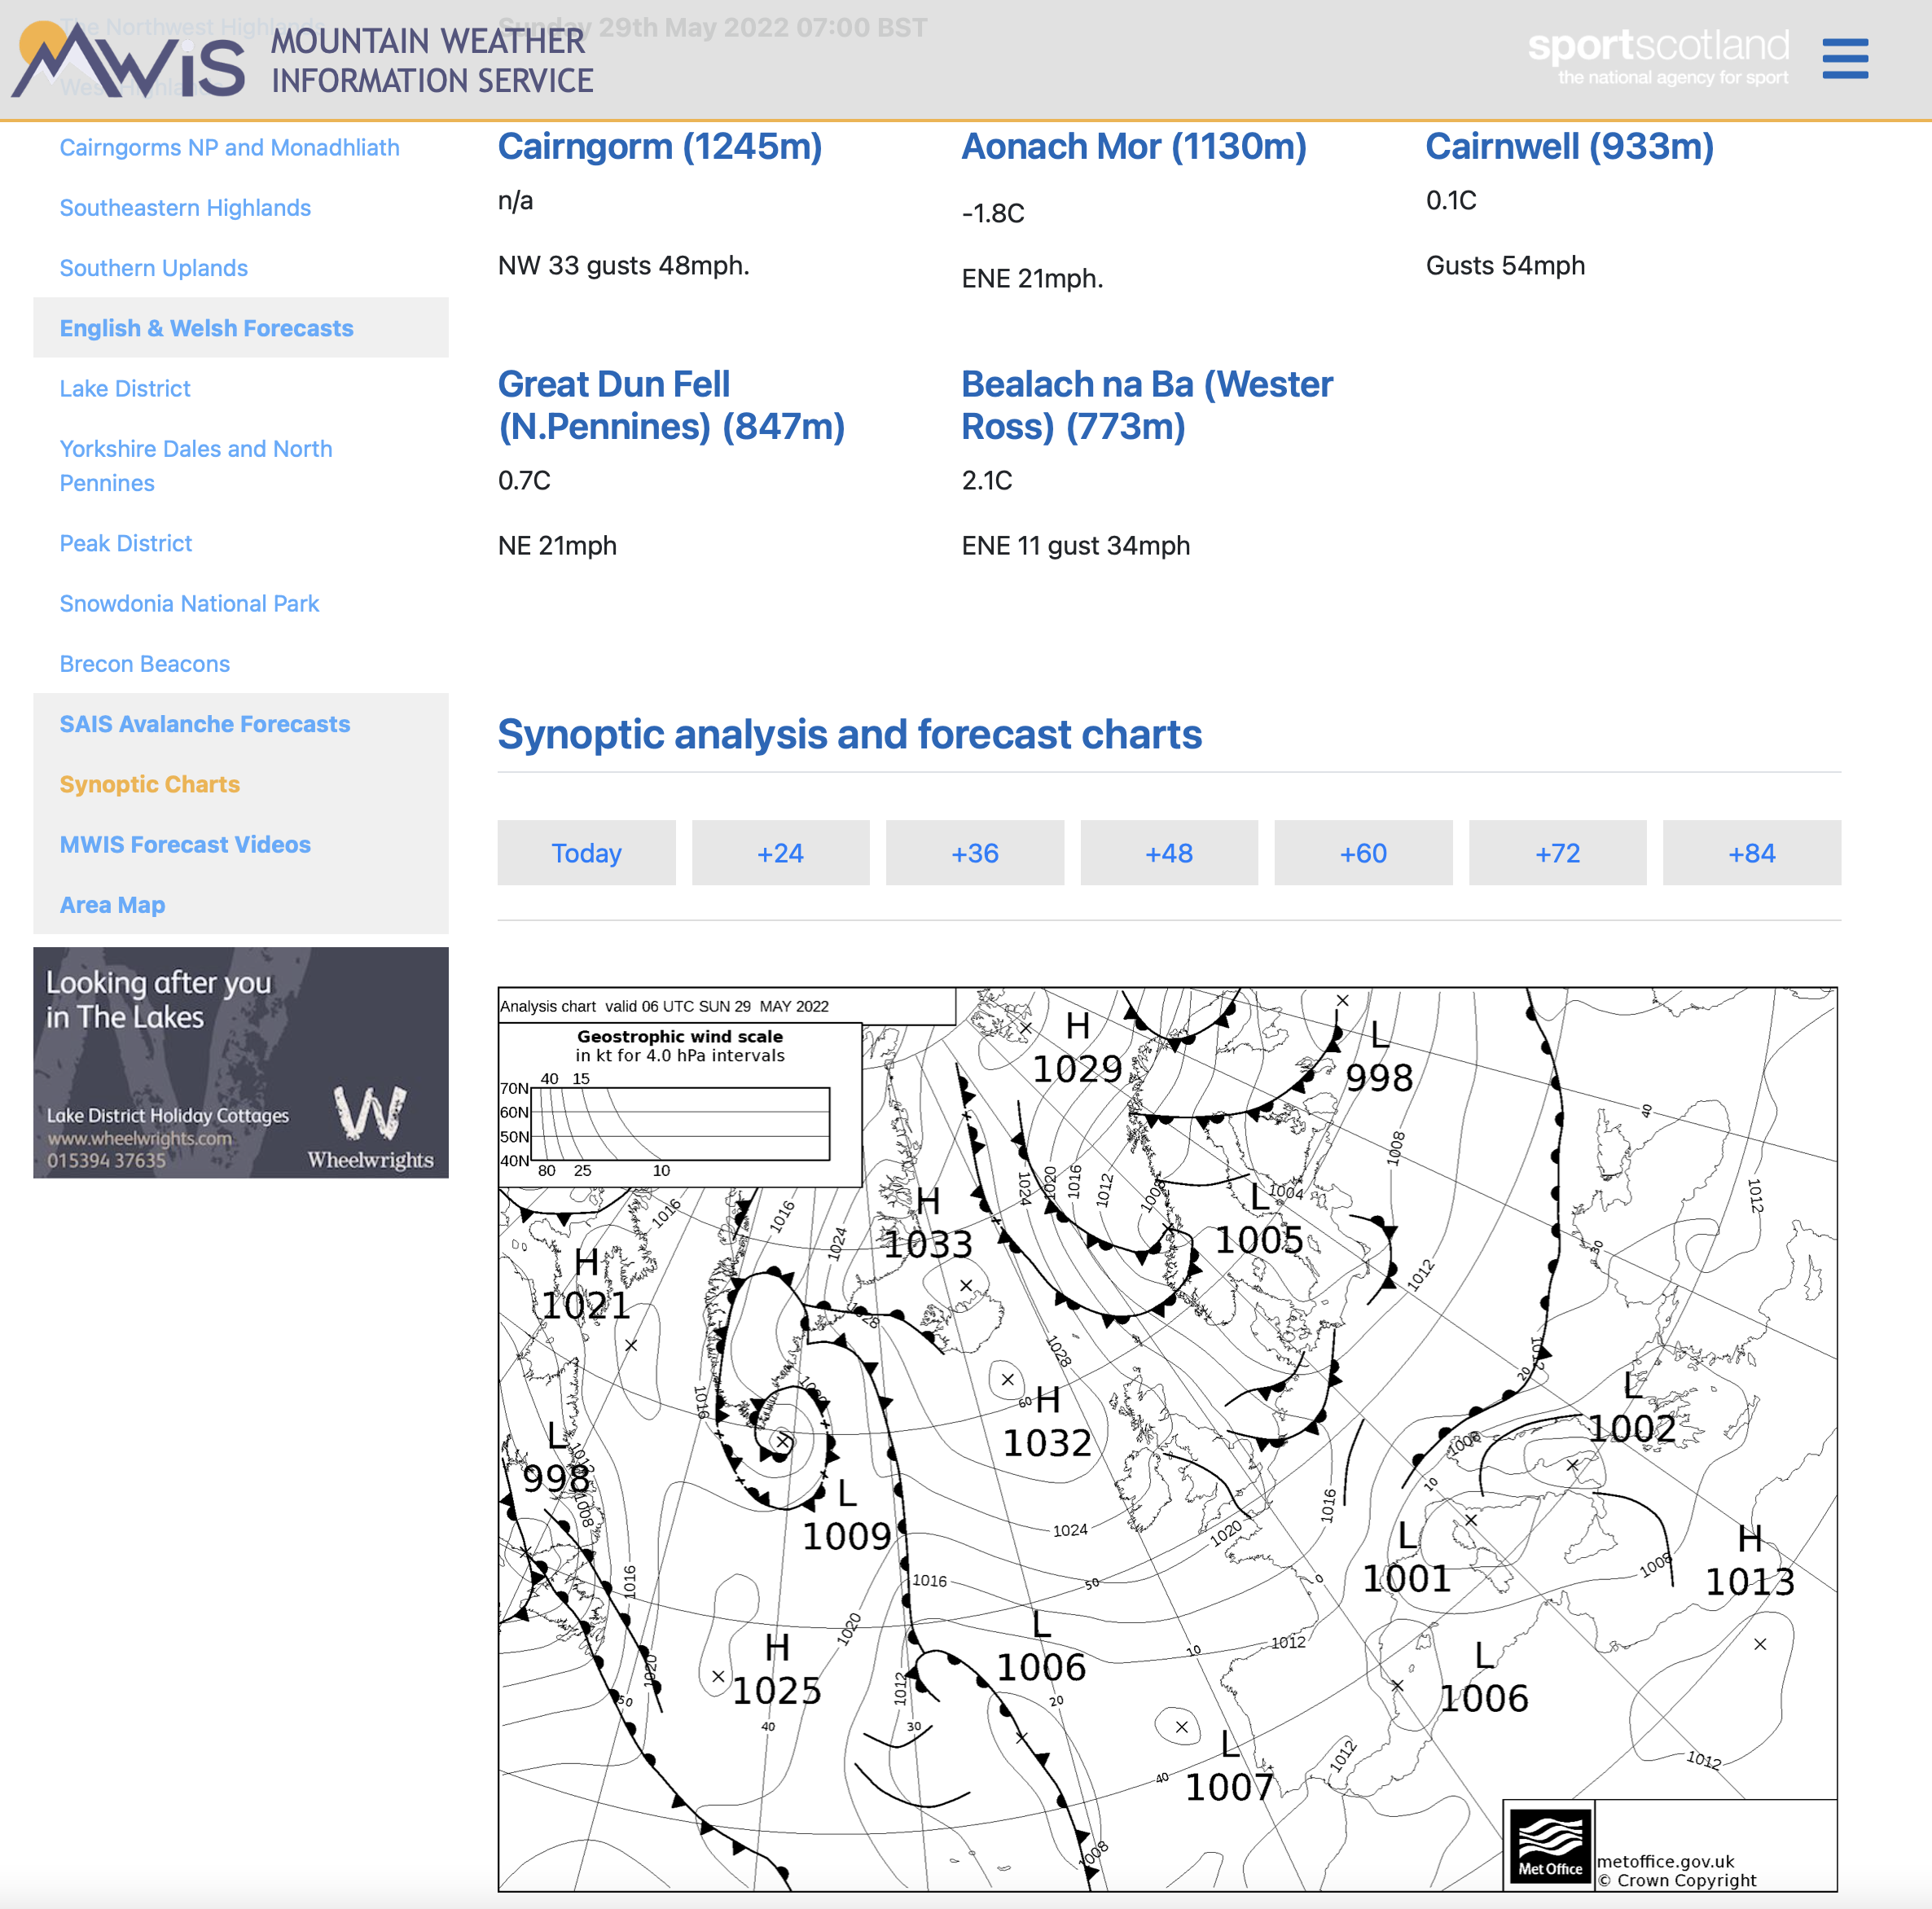
- Mountain Weather Information Service (MWIS) website. A few years ago this was the only source of weather forecasting information that specifically focused on the mountains. It’s no longer the ‘only kid in town’ but it certainly still plays an important part in my planning. It has a limitation, however, in that the forecast is released in the late-afternoon. This can mean that by the time you are out in the hills your forecast is about 18 hours old.
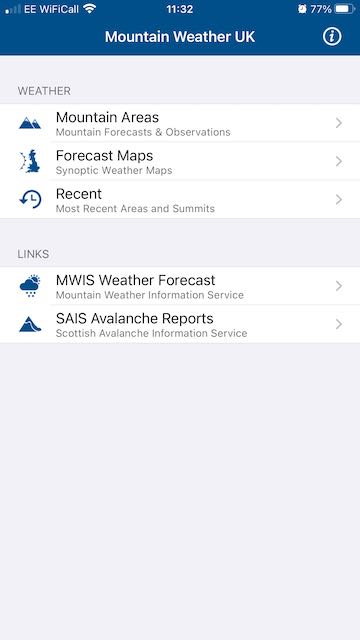
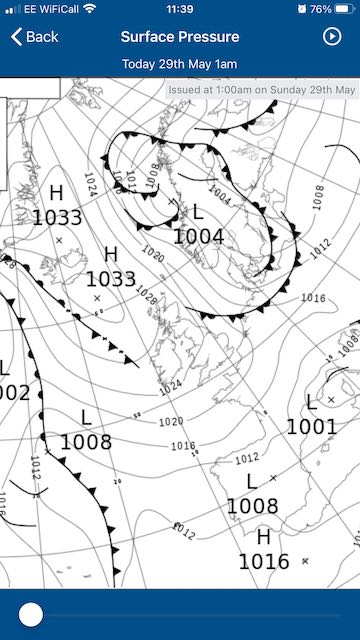
- Mountain Weather UK (MWUK) mobile app. This incredibly useful app isn’t a forecasting service itself, but acts as a one-stop-shop for access to other resources. These include Met Office forecasts, live weather station data, the MWIS published forecasts and the SAIS avalanche forecasts.

National Weather Forecast and Outlook
As I mentioned, my first step is to try and understand the overall weather picture affecting the UK for the next 48 hours.
This will help me to put detailed information into a wider context, which is important. In particular, I want to know whether the overall forecast in the next 24-48 hours will improve (significantly); deteriorate (significantly); or stay pretty much the same. (I also consider this question in my detailed daily planning for the next 8-12 hour period).
The best way to do this is by looking at the synoptic chart for the UK. These charts take a little getting use to, but it is worth the effort. Once familiar with these, you can draw out some important information very quickly.
If I am on a desktop screen, then I may use the Met Office and/or MWIS websites for this. If I am only smartphone, then I use the MWUK app. All three offer a animation feature which lets you run through the changes in the synoptic chart (surface pressure chart) for the next few days.
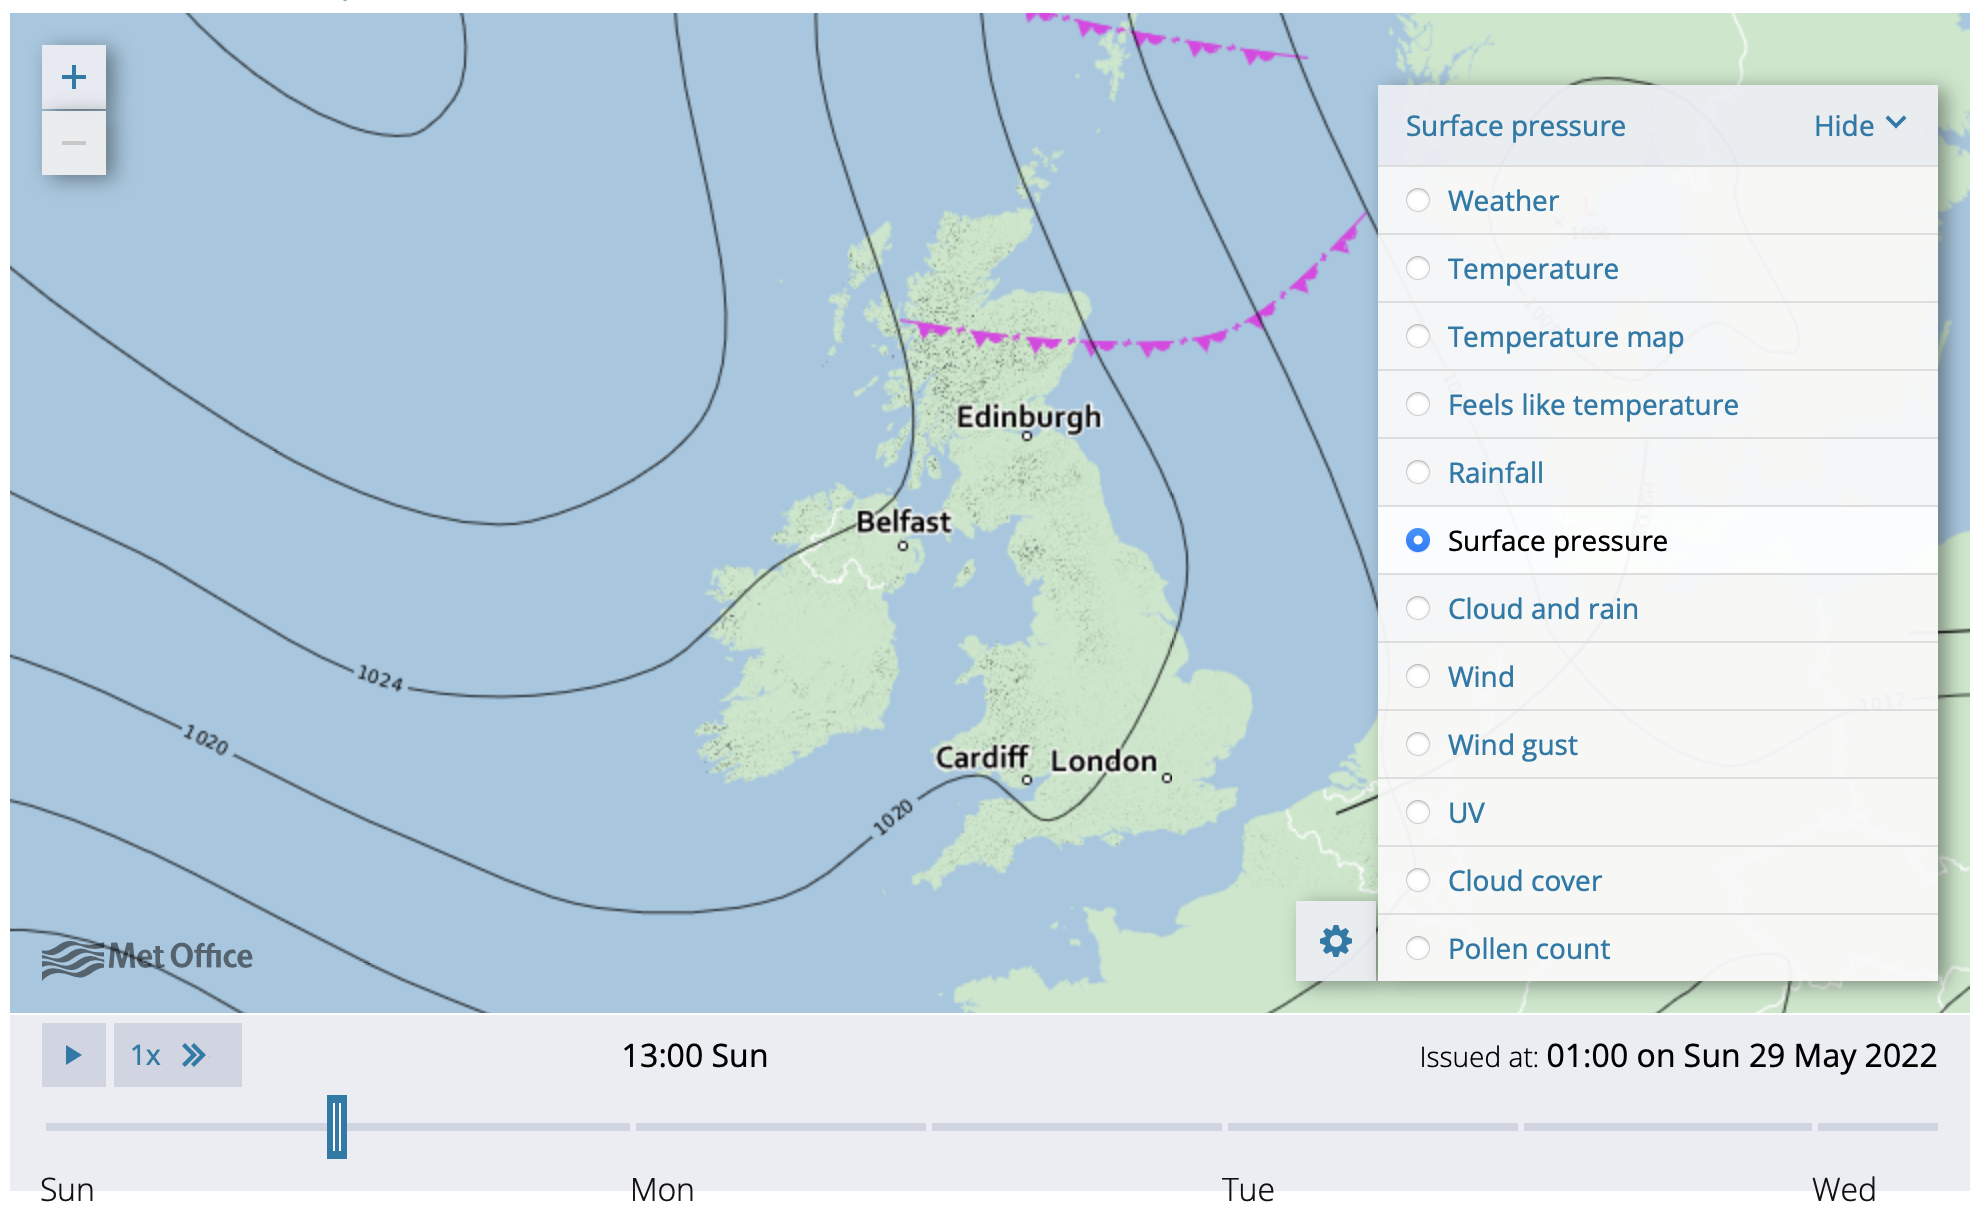
Points to Look For
Here’s what I look for at this stage of my thought process in understanding the mountain weather forecast:
- Is the UK generally subject to High pressure (usually ‘good’ weather) or Low pressure (usually ‘bad’ weather?
- Will it change, and when? For better or for worse?
- What main air-flows will be affecting the UK as a result? Is it a cold, dry north-easterly or a mild, wet south-westerly. This will definitely have an effect on where I choose to go, especially in Scotland in winter.
- Is the pressure map ‘neat and tidy’? If it is, then this generally indicates that the weather will follow a predictable pattern (even if it is ‘bad’ weather) and the forecasters are probably very confident in their forecasts.
- Or is the pressure map messy and confused? Is it difficult to work out what is going on? If so, the weather is likely to be unsettled and less predictable; and the forecasters will have a lower level of confidence in their forecasts.
This stage of my thought process will usually help me make big overall choices about where to go and why. For example, in summer it might be that the Peak District will be a drier choice for rock-climbing than Snowdonia. Or in winter, it might be that good ice is likely to have formed in the eastern highlands of Scotland and that’s where I should go.
Summary
- I follow a logical process in understanding mountain weather forecasts. I work from the very general overview down to the very detailed and specific data.
- This means looking at National, then Regional, and then Local forecasts.
- I use a combination of the Met Office and MWIS websites along with the mobile app MWUK.
- The synoptic chart or surface pressure map is the main way that I understand the overall weather picture.
- The main things to look for in this chart are areas of High and Low pressure; and from that to understand the direction and strength of the airflows (along with understanding what this might mean in practice).
Next month I’ll explain how I go about researching and understanding the Regional forecasts.
Contains public sector information licensed under the Open Government Licence v3.0