Introduction
This tip is all about how to estimate slope angle from a map. Next month, I’ll look at how to estimate slope angle in the field by relating it to everyday life, which we can do intuitively.
Why is this important? Well, for safe travel in the winter mountains we should avoid slopes that are potentially avalanche-prone. So we have to know in advance which ones they may be.
Three ‘A’s
One way that we can consider the likelihood of an avalanche in a particular place on a particular day, is using the three ‘A’s. These stand for Altitude, Aspect (the direction the slope faces), and Angle.
In the UK, we can get up to date forecast information from the Scottish Avalanche Information Service (SAIS). The daily forecast will certainly cover the Altitude and Aspect information. But we still need to have a deeper understanding of what causes avalanche, including the third ‘A’ – the slope angle.
Knowing how to estimate the slope angle from the map is a vital part of this. It should form part of our planning thought-process before deciding on a route for the day.
Ideal Slope Angle for Avalanche
Here are some of of the basic facts about avalanches and slope angles:
- Around 80% of avalanches occur on slopes of between 35° and 45°.
- The optimum angle for avalanche release is about 38°.
- Avalanches occur on slopes up to about 50°, but not so much above this angle. This is because it is too steep for snow to accumulate.
- Avalanches can occur on slopes as gentle as just over 20°, but are not frequent because the gradient is too gentle to help the snow slide.
- A useful summation of all this information, is that 98% of avalanches occur on slopes over 27°.
Therefore on any given day our safest route will avoid slopes with an angle of 27° or more, on the aspects and at the altitudes that the forecast suggests are most risky.
To do this, we need to be able to estimate a slope angle of 27° from our maps.
Estimate Slope Angle from the Map
Estimating the slope angle from the contour lines of a map will seem a little confusing and daunting at first. But fortunately we have some mathematical coincidences and quirks on our side.
- A slope angle of 27° is a gradient of 1:2.
- On OS maps the contour interval is 10 metres with the index contours at 50m.
- Therefore on a 1:50,000 scale map a 1:2 gradient occurs when the 50m index contour lines are 2mm apart.
- On a 1:25,000 scale map a 1:2 gradient occurs when the 50m index contour lines are 4mm apart.
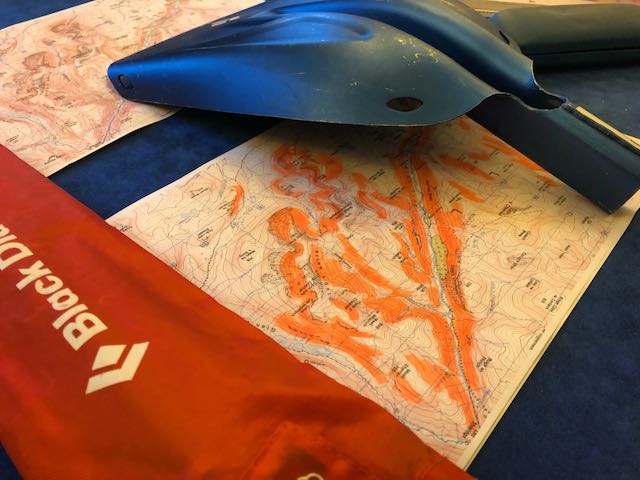
So all we have to do is to use a ruler (such as on the side of our compass) and identify all the areas where the index contour lines are closer than 2mm (on a 1:50,000 scale map). The photo shows a map which has been shaded/highlighted where we have estimated the slope angle to be 27° or more.

These are the areas of terrain where an avalanche is most likely to be released.
This is an exercise to do at home or in the pub the night before (or earlier). It’s not an exercise to do ‘in the field’.
Zones of an Avalanche
An avalanche can be sub-divided into three main zones. These are (1) the release or trigger zone; (2) the track or path, where the avalanche moves at its fastest; and (3) the run-out or deposition zone, where the avalanche decelerates and comes to rest, depositing its debris.
If we have done the planning exercise above, then we have now estimated the slope angles greater than 27° where an avalanche is most likely to be released. But this does not mean that everywhere else is ‘safe’.
Anywhere below these slopes are potential avalanche paths and anywhere at the foot of the slope is a potential run-out zone. This is where one could easily be buried under an avalanche that was triggered on a slope far above.
Useful Apps
As with so many things these days, there are apps that can help with this. However, even if you prefer apps, I’d recommend doing this with a paper map and ruler/compass at least once. This is so that the concept is firmly embedded in your understanding.
Fatmap is one useful solution. This app has useful tools to highlight Gradient (slope angle), Altitude and Aspect. The app superimposes coloured layers onto a 3-D satellite image.
Outdooractive also has a useful slope angle layer to help visualise the critical slopes. This tool ‘shades’ the standard OS map automatically as in the manual exercise described above.
Summary
Estimating the slope angle from the map is a vital part of planning for safe travel in avalanche terrain.
- 98% of avalanches occur on slopes over 27°.
- 80% of avalanches occur on slopes between 35° and 45°.
- A slope of 27° is a gradient of 1:2. This equates to the 50m index contour lines on a 1:50,000 scale map being 2mm apart. On a 1:25,000 scale map the 50m index contour lines will be 4mm apart.
- Identifying all areas where contour lines indicate a slope of 27° or more shows the most likely areas for an avalanche to release.
- We also need to avoid the potential avalanche paths and run-out zones below the release zones.
- We can use an app to help, but using a map and compass will deepen your understanding.


